Chart Series Stack Mode
If you followed the getting started article, you now know how to create a chart and add it to a NativeScript page. In this article, you will learn how the chart will visualize its series if they are more than one.
Getting Started
There are scenarios in which a single Categorical chart can host multiple series. The stackMode property allows you to define how these series will interact with each other. The following options are available for the stackMode property:
-
None- The data points for all series start drawing from the axis. -
Stack- The data points for each series start drawing from the end of the data points of the previous series. -
Stack100- The data points for each series start drawing from the end of the data points of the previous series but their size is adjusted proportionally so that the whole plot-area of the chart is filled.
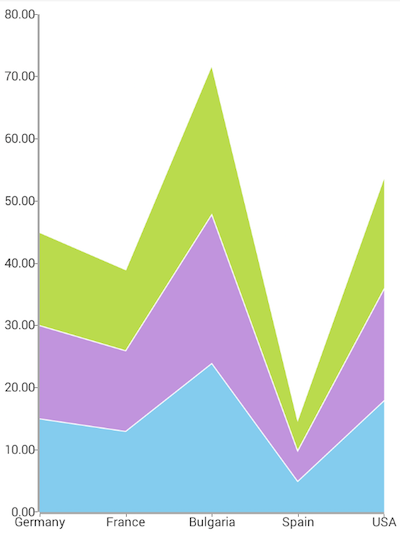
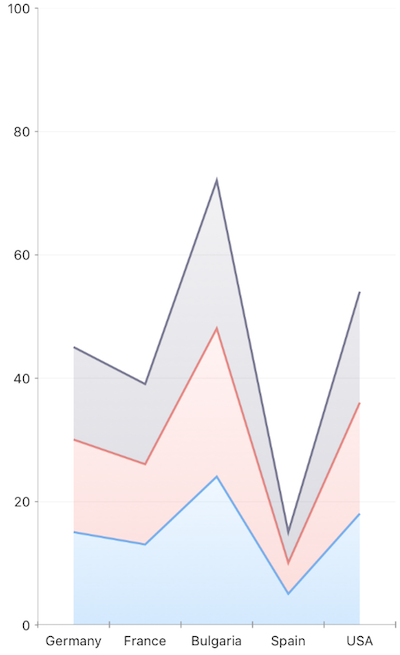
Here's how your chart will look like with stackMode set to Stack:
Figure 1: Chart with stacked AreaSeries on Android (left) and iOS (right)


References
Want to see this scenario in action? Check our SDK Examples repository on GitHub. You will find this and many other practical examples with NativeScript UI.
Examples used in this article:
Related articles you might find useful: