Chart Getting Started
In this article, you will learn to start using NativeScript UI Chart: how to initialize the chart, how to create the data series and how to use the different axes.
Plugin Installation
Run the following command to add the plugin to your application:
tns plugin add nativescript-ui-chart
Add Chart to Component Template
Before proceeding, make sure that the nativescript-ui-chart/vue plugin is installed in your main application file (usually main.js or main.ts). This plugin handles the registration of the custom directives and elements required by nativescript-vue.
Example 1: Register Chat Vue component
import Vue from 'nativescript-vue';
import RadChart from 'nativescript-ui-chart/vue';

Vue.use(RadChart);
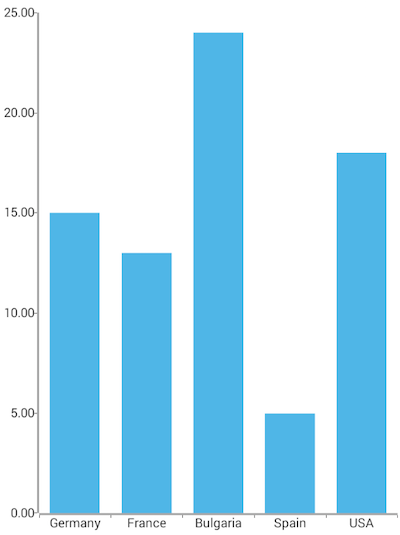
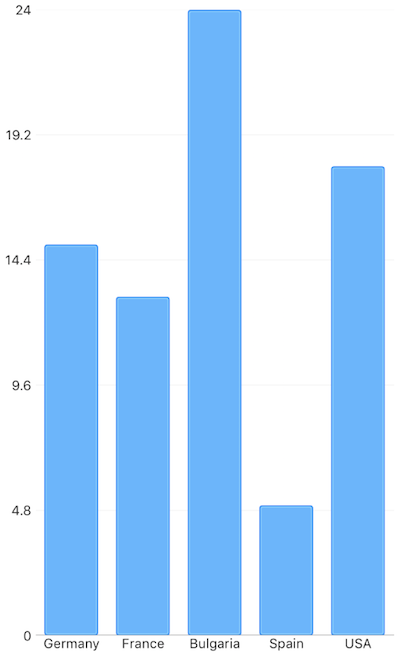
Now, you can use all the chart components and directives, as the RadCartesianChart, RadPieChart, etc. Look at this example component:
Example 2: Code of component:
import { getCountriesData } from '../../data';

const description = 'Bar Series';

export default {
  name: 'BarSeriesExample',
  description: description,
  template: `
  <Page>
    <ActionBar :title="title">
      <NavigationButton text="Back" android.systemIcon="ic_menu_back" @tap="onNavigationButtonTap"></NavigationButton>
    </ActionBar>
    <RadCartesianChart>
      <CategoricalAxis v-tkCartesianHorizontalAxis></CategoricalAxis>
      <LinearAxis v-tkCartesianVerticalAxis></LinearAxis>
      <BarSeries v-tkCartesianSeries :items="items" categoryProperty="Country" valueProperty="Amount"></BarSeries>
    </RadCartesianChart>
  </Page>
  `,
  data () {
    return {
      title: description,
      items: getCountriesData(),
    };
  },
  methods: {
    onNavigationButtonTap() {
      Frame.topmost().goBack();
    },
  },
};
Figure 1: Chart with BarSeries on Android (left) and iOS (right)


References
Want to see this scenario in action? Check our SDK Examples repository on GitHub. You will find this and many other practical examples with NativeScript UI.
Examples used in this article:
Related articles you might find useful: